
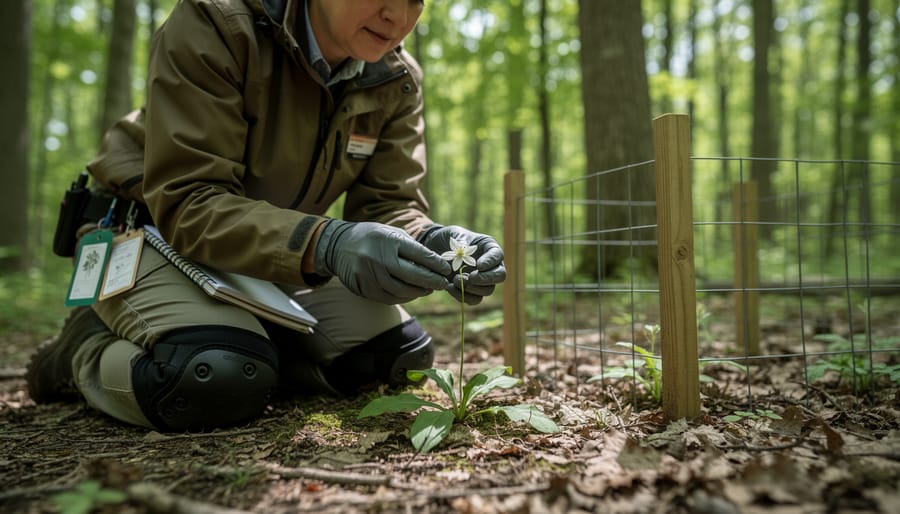
The FNAI biodiversity matrix is a standardized ranking system developed by the Florida Natural Areas Inventory that assigns conservation status codes to plant and animal species based on their rarity and threat level, both globally and within specific regions. Think of it as a universal language that conservation biologists, ecologists, and land managers use to quickly communicate how vulnerable a species is to extinction.
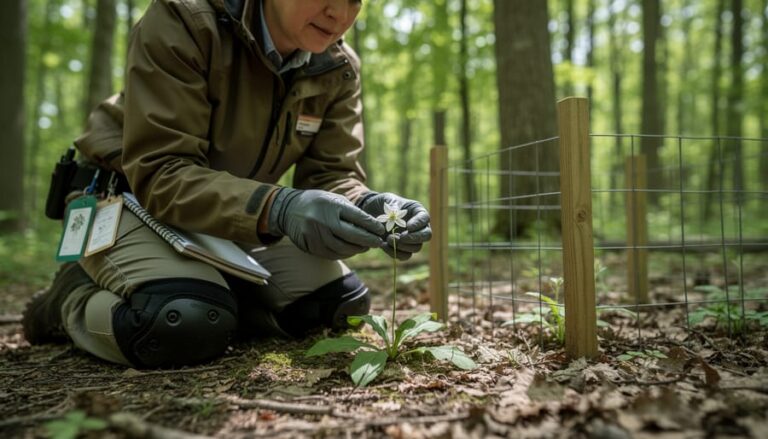
If you’ve ever wondered why some wildflowers in Ontario’s provincial parks have protective fencing around them while others grow freely along trails, the answer often traces back to ranking systems like this. The matrix works by combining two key measures: a species’ global status (how rare it is worldwide) and its state or provincial status (how common or threatened it is locally). A species might be globally secure but extremely rare in Ontario, or vice versa, and these distinctions directly shape habitat protection decisions and park management strategies.
Here’s where modern technology makes this relevant to your next hiking trip. AI-powered plant identification apps in 2026 now integrate biodiversity rankings into their results, alerting you when you’ve spotted something truly special. That delicate orchid you photograph on a Bruce Trail hike might trigger a notification that it’s an S1 species in Ontario, meaning critically imperiled in the province. These tools turn casual nature walks into meaningful citizen science opportunities, helping conservation efforts while deepening your appreciation for the rare species thriving in your favorite outdoor spaces. Understanding this classification system transforms how you explore Ontario’s natural areas, adding context to every discovery.
What the FNAI Biodiversity Matrix Means for Nature Lovers
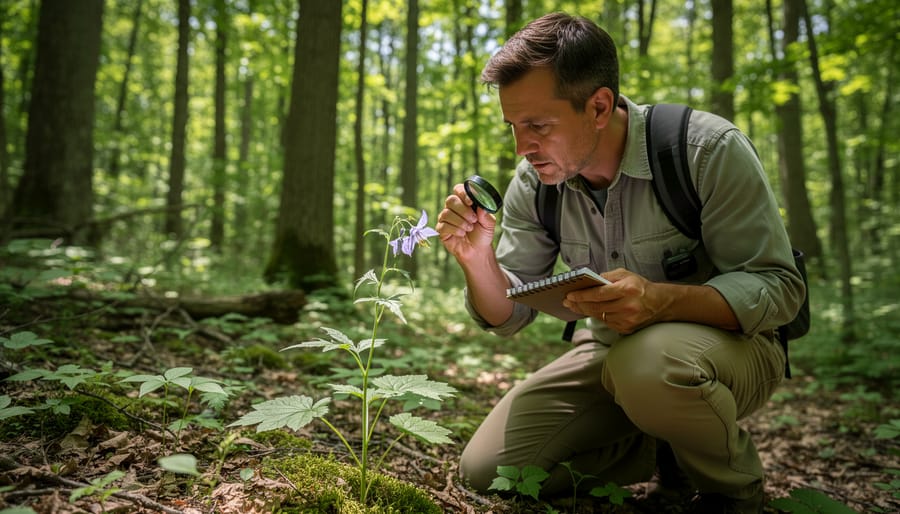
Think of the FNAI biodiversity matrix as a conservation report card for nature. Developed by Florida Natural Areas Inventory, this grid system assigns each plant and animal species a letter-and-number code that tells you exactly how rare and threatened it is. When you’re hiking through Grundy Lake or exploring the wetlands at Long Point, those cryptic rankings like “G2S1” on a park interpretive sign actually reveal whether you’re looking at something common as a chickadee or precious as platinum.
The matrix works on two axes. The G-rank (global) tells you how a species is doing worldwide, while the S-rank (state or provincial) shows its status in your specific region. A G5 species is secure across its entire range, but that same plant might be S1 in Ontario, critically imperiled here even though it thrives elsewhere. That’s why you might spot a wildflower considered common in the southeastern United States that’s worth celebrating when you find it clinging to a Bruce Peninsula cliff.
Here’s what the core terms mean when you encounter them:
- Global rank (G-rank)
- A species’ conservation status across its entire worldwide range, rated from G1 (critically imperiled everywhere) to G5 (common and widespread). This tells you the big picture.
- State/Provincial rank (S-rank)
- How secure a species is within a specific political boundary like Ontario, using the same 1-5 scale. A globally common species can still be provincially rare.
- Biodiversity matrix
- The grid format combining G-ranks and S-ranks to prioritize conservation action. Species ranking G1S1 need immediate protection, while G5S5 species are stable.
- Element occurrence
- A documented location where a tracked species actually lives. Biologists map these occurrences to understand a species’ distribution and habitat needs.
- Conservation status
- The overall assessment of how threatened a species is, determined by combining rarity, population trends, threats, and ecological factors into the FNAI conservation ranking categories.
Ontario uses a parallel system through the Natural Heritage Information Centre, applying these same principles to track everything from Blanding’s turtles to eastern prairie fringed orchids. When you’re using an AI plant identification app on your phone during a camping trip, many now pull in these rankings automatically. Snap a photo of that unusual fern, and the app might flag it as S2, telling you you’ve just found something imperiled in Ontario that deserves a careful observation uploaded to citizen science databases.
Understanding these codes transforms your park visits from casual walks into treasure hunts where you’re genuinely contributing to conservation knowledge.
How the Biodiversity Matrix Classification Works
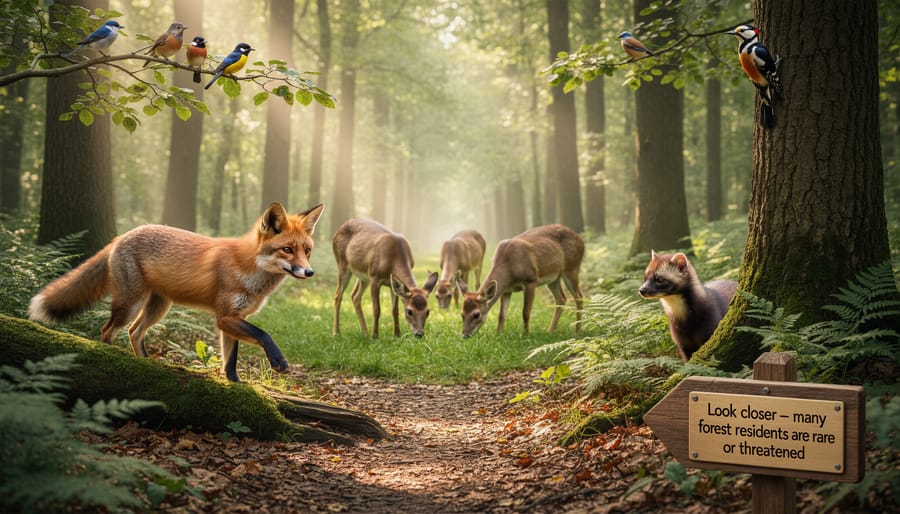
The Ranking Categories Explained
Picture yourself on a misty morning trail in Algonquin Park when you spot a delicate Hart’s-tongue fern tucked into a limestone crevice. That moment becomes more meaningful when you know you’re looking at an S2 species, imperiled in Ontario with fewer than 20 known locations.
The ranking system uses a simple scale from 1 to 5, applied at both global (G) and state or provincial (S) levels. A G1 or S1 ranking means critically imperiled, with five or fewer occurrences. These are the rarest of the rare. Ontario’s American chestnut, relegated to S1 status after disease decimated populations, survives in just a handful of sites. If you encounter one, you’ve found something extraordinary.
G2/S2 species are imperiled, typically with 6-20 occurrences. The dwarf lake iris, blooming along Bruce Peninsula shorelines each spring, holds this status. Park visitors often walk past these purple beauties without realizing they’re seeing something genuinely uncommon.
Moving up the scale, G3/S3 indicates vulnerable species with 21-100 occurrences. Ontario’s pitch pine, clinging to rocky outcrops in places like Killbear Provincial Park, fits here. They’re not critically endangered, but they need attention.
G4/S4 species are apparently secure, with more than 100 occurrences but still facing some concerns. Meanwhile, G5/S5 marks secure species, the white pine forests and sugar maples that define Ontario’s landscapes. These rankings aren’t static; as habitats change and populations shift, species move up or down the scale, making every observation from park visitors valuable data for conservation tracking.
Assessment Criteria Behind the Rankings
When biologists assess a species for conservation ranking, they’re essentially asking five key questions. First, how many distinct populations exist? A plant found in just three locations raises more concern than one scattered across fifty sites. Second, what’s the total population size? Even twenty colonies matter less if each holds only a handful of individuals.
Geographic range comes next, species confined to a single valley face higher extinction risk than those spanning multiple regions. That rare orchid you spot in Pinery Provincial Park might exist nowhere else in Canada, making its S-ranking critically important.
Threat severity weighs current dangers: invasive species crowding out native plants, development fragmenting habitat, or climate shifts altering growing conditions. The speed and scale of these threats directly influence rankings. Scientists also examine habitat quality and trends, is suitable habitat expanding, stable, or shrinking? A species with declining populations across degraded sites moves toward more imperiled categories.
These factors work together rather than in isolation. An Ontario fern with moderate population numbers but rapidly disappearing wetland habitat might rank as threatened, while another with smaller numbers in stable, protected areas could be less urgent. Rankings reflect this nuanced view of vulnerability.
Components of Modern Biodiversity Assessment Systems
Modern biodiversity tracking isn’t a single database or app, it’s an ecosystem of interconnected tools and data sources that scientists and naturalists use together. Understanding these components helps you appreciate what’s happening behind the scenes when you pull out your phone to identify a wildflower in Frontenac Provincial Park or when conservation teams decide which areas need protection.
The FNAI matrix doesn’t operate in isolation. It draws from and contributes to a sophisticated network of biodiversity information systems that includes:
- Field survey data collected by trained botanists and naturalists documenting species locations and populations
- Historical records from herbarium specimens preserved in institutions like the Royal Ontario Museum and university collections
- GIS mapping layers showing habitat types, land use changes, and species distribution patterns
- Ecological modeling that predicts where rare species might occur based on environmental conditions
- AI species identification tools that process millions of photos to confirm identifications and track observations
- Threat assessment protocols evaluating development pressure, climate impacts, and invasive species risks
Field observation databases form the foundation. Every time a botanist records a rare orchid location or a citizen scientist logs a butterfly sighting through iNaturalist, that data point feeds into conservation status assessments. These observations get verified, georeferenced, and added to occurrence records that help determine whether a species qualifies as S1 or S3 in Ontario.
Herbarium specimens provide the historical backbone. Pressed plants from decades or centuries ago let researchers track how species ranges have shifted, which populations have disappeared, and whether a plant thought extinct might still survive somewhere. When you see a dusty cabinet of mounted specimens, you’re looking at baseline data that informs current rankings.
Remote sensing technology, satellite imagery, drone surveys, LiDAR mapping, lets scientists monitor habitat changes at landscape scale. This matters because a species might be ranked secure globally but lose critical breeding habitat in Ontario, triggering a provincial status review. The integration of AI protecting parks from development before ground breaks shows how these mapping systems now work proactively.
AI-powered identification tools represent the newest layer. They don’t replace expert botanists, but they democratize biodiversity monitoring. When thousands of park visitors contribute verified observations, the cumulative data reveals population trends that would take field teams years to document manually. These crowd-sourced datasets now inform the very rankings the FNAI matrix tracks.
How AI-Enabled Tools Use Biodiversity Rankings in the Field
Apps and Tools for Park Visitors
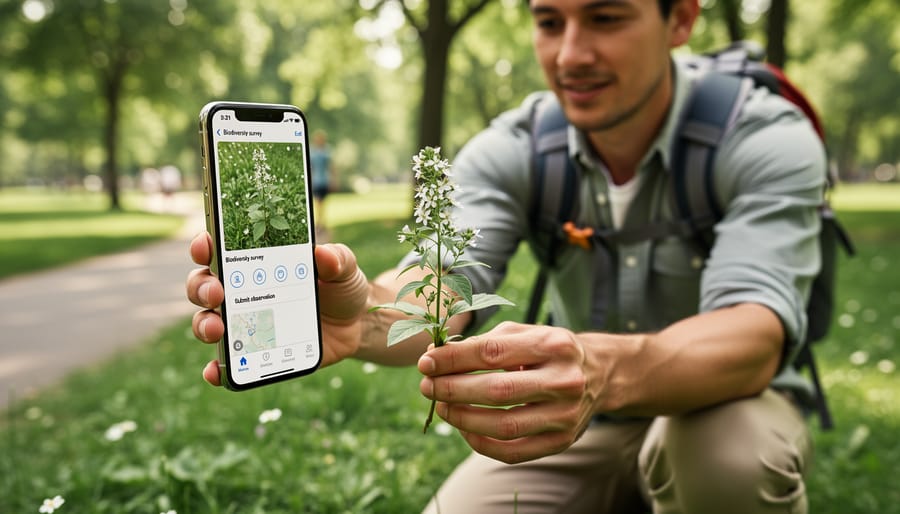
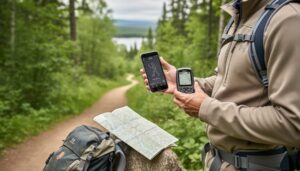
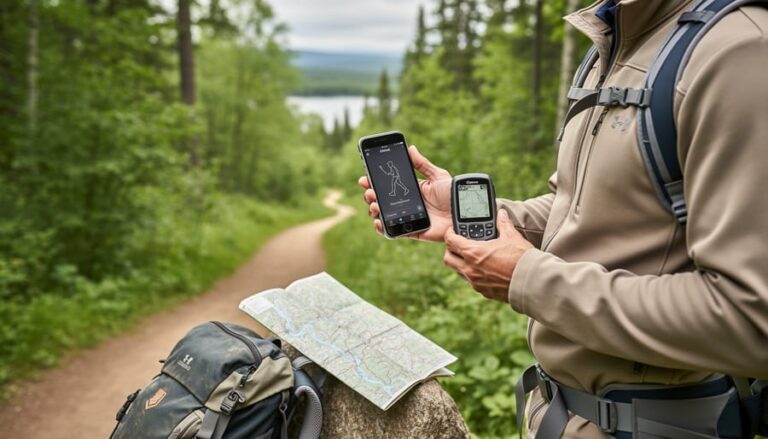
Several free apps now put professional-grade biodiversity tracking in your pocket while you’re hiking Ontario’s trails. iNaturalist leads the pack, snap a photo of that unusual wildflower near your campsite, and the app’s AI identifies it while displaying its conservation status. When you spot an S1-ranked species, the app flags it immediately and connects your observation to researchers monitoring rare populations. I’ve used it dozens of times in Frontenac Park, and it’s remarkable how quickly you start noticing species you’d have walked right past before.
Seek (iNaturalist’s beginner-friendly version) works brilliantly for families exploring parks together. Point your smartphone plant field guide at a fern or moss, and kids get instant feedback with conservation rankings explained in simple terms. The gamification aspect, earning badges for finding different species, turns educational hikes into treasure hunts.
PlantNet excels at botanical accuracy and incorporates global conservation data, though understanding the AI-enabled meaning behind its identifications helps you verify tricky specimens. For best results, photograph leaves, flowers, and bark separately in good natural light.
Insider tip: download species data for offline use before heading into parks with spotty cell service. Many Ontario parks now offer interpretation programs that complement these digital tools, and some have started integrating AR wildlife tours that overlay conservation information as you explore.
Citizen Science and Conservation Data
Every photo you snap and upload while hiking Ontario’s trails can become a valuable data point in provincial conservation efforts. When you use AI-powered identification apps to document plants during your camping trips, those observations don’t just satisfy your curiosity, they flow into comprehensive biodiversity databases that scientists and park managers rely on for decision-making.
Platforms like iNaturalist connect casual park visitors with researchers tracking species distribution and population trends across Ontario. Your photo of a trillium in Killbear Provincial Park or a rare fern in Quetico gets verified by experts and added to occurrence records that help determine conservation priorities. These crowdsourced observations are particularly valuable for documenting species in remote areas that scientists can’t monitor regularly.
The impact goes beyond individual sightings. When hundreds of visitors document the same species across different locations and seasons, patterns emerge that reveal habitat preferences, flowering times, and range shifts potentially linked to climate change. Conservation planners use this aggregated data to identify critical habitats worth protecting and to track whether species ranked as S2 or S3 are recovering or declining.
Your contributions matter most when you include accurate location data, clear photos, and visit dates. Even common species observations help establish baseline data that makes rare species sightings more meaningful. By simply documenting what you see during your park adventures, you’re participating in real-time biodiversity monitoring that shapes how Ontario protects its natural heritage.
Using Biodiversity Data During Your Ontario Park Adventures
When you’re hiking the trails at Algonquin or exploring the rocky shores of Lake Superior Provincial Park, understanding biodiversity rankings transforms casual observation into meaningful discovery. I’ll never forget the afternoon I spotted a cluster of Ram’s-head Lady’s-slippers along a Bruce Trail side path, their distinctive pink pouches unmistakable against the forest floor. Checking my plant ID app revealed their S2 ranking in Ontario, making that encounter feel like finding treasure.
Before you photograph or document any species with a conservation ranking below S3, take a moment to observe from a distance. Rare plants are often fragile, and trampling the area around them can damage root systems or crush seedlings you might not see. Stay on established trails and use your phone’s zoom rather than stepping closer. If you’re using an AI identification app that flags a species as critically imperiled (S1 or S2), note the location coordinates but avoid sharing exact GPS data publicly, some rare orchids and ferns have fallen victim to poachers who scour social media for collection sites.
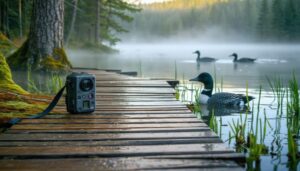
Park staff genuinely appreciate reports of rare species sightings. Most Ontario provincial parks have naturalist programs or visitor centers where you can mention what you’ve found. I’ve made it a habit to stop by the office after a day hike to share any interesting observations, especially if an app has flagged something unusual. Rangers often follow up on these reports, contributing valuable data to provincial biodiversity monitoring efforts, work that complements research using tiny trackers and other conservation technologies.
The real joy comes from developing what I call “conservation eyes”, that awareness that turns every walk into a hunt for biodiversity gems. Knowing a plant’s ranking adds context and urgency to each encounter, deepening your connection to the landscape you’re exploring.
Common Questions About Biodiversity Rankings and Assessment
You’re probably wondering how these rankings actually get updated, or whether that rare plant you spotted on your Algonquin hike is protected by law. These questions come up constantly among park visitors who’ve started paying attention to conservation status through their AI plant apps, so let’s clear up the most common curiosities.
How often are biodiversity rankings updated?
Most jurisdictions review conservation rankings every few years as new field data and population surveys come in. Significant discoveries, like finding a healthy new population of a rare species, can trigger earlier updates to reflect improved status.
Can I actually help rare species recovery as a park visitor?
Absolutely. Recording accurate observations through apps like iNaturalist provides data that conservation scientists use to track species distributions and population trends. Staying on marked trails and respecting sensitive areas also prevents habitat damage that threatens imperiled species.
Why do some common-looking plants have rare rankings?
A species might be locally abundant in one area but globally rare overall, or it could have a restricted range that makes it vulnerable despite healthy numbers in specific locations. What looks plentiful on your favorite Bruce Peninsula trail might exist almost nowhere else on Earth.
Is it illegal to photograph rare plants in Ontario parks?
Photography is generally fine and encouraged for documentation purposes. However, picking, damaging, or removing any plants from provincial parks is prohibited, and some extremely sensitive sites may have specific access restrictions posted by park staff.
One thing that surprises many Ontario hikers is learning that our provincial ranking system works similarly to FNAI’s approach but uses slightly different reporting structures. Ontario’s Natural Heritage Information Centre maintains S-ranks for species within the province using the same G1-G5 global framework, so the conservation status you see in your plant ID app translates directly to local management priorities. When you spot an S1 orchid along a Killarney trail, park managers use that ranking to guide habitat protection decisions and trail routing.
The beauty of this system is how it connects your casual nature walk to real conservation outcomes. That photo you uploaded of an unfamiliar fern becomes part of the scientific record, potentially filling gaps in our understanding of where rare species persist and how they’re responding to environmental changes.
Understanding biodiversity rankings transforms a simple hike through Algonquin or a weekend at Bruce Peninsula into something deeper, you’re not just identifying wildflowers, you’re connecting with conservation stories that span continents. That S1-ranked orchid you photograph isn’t just rare; it represents decades of habitat protection efforts and ongoing monitoring work.
The real beauty of AI-powered tools is how they’ve democratized this knowledge. You don’t need a botany degree to recognize when you’ve spotted something significant. Your phone can tell you instantly, and your observation, uploaded to platforms like iNaturalist, becomes part of the living database that guides conservation decisions. Every photo matters, every sighting counts.
Next time you’re exploring Ontario’s parks, take a moment to check those conservation rankings. Notice the patterns, ask questions, share your discoveries with park staff. You’re not just a visitor passing through; you’re part of the broader effort to understand and protect Ontario’s natural heritage. Technology has given us the tools. Now it’s up to us to explore with curiosity, document with care, and appreciate the remarkable biodiversity right in our backyard.


+ There are no comments
Add yours