
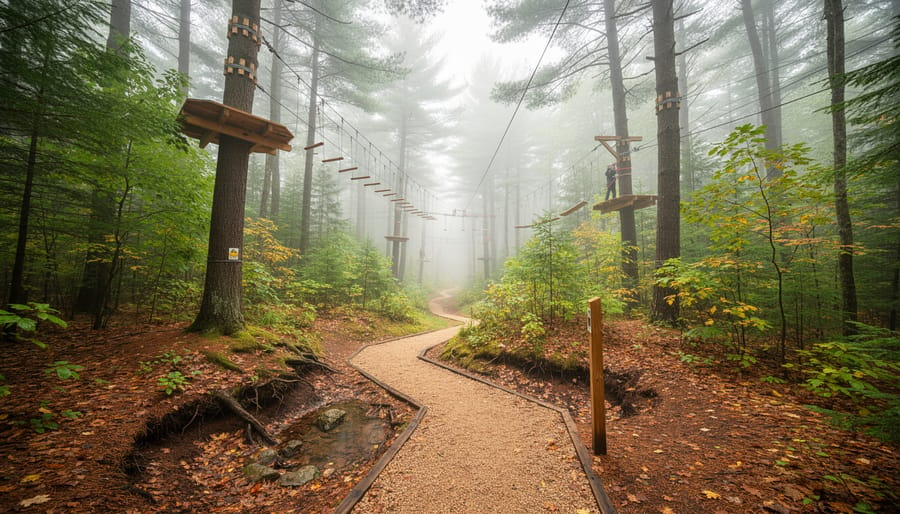
Planning a canopy course or aerial adventure park starts with understanding the ground beneath your feet and the forest canopy above. Four-level map analysis gives you a systematic way to evaluate terrain, identify natural anchors, spot hazards, and design safe, thrilling routes through the trees. This methodology breaks the landscape into four distinct layers: the ground level (access, drainage, and obstacles), the understory (vegetation and sightlines), the canopy zone (tree health, spacing, and anchor points), and the operational overlay (safety zones, emergency access, and flow). By working through each level in sequence, you’ll catch problems early, make smarter design choices, and build a course that works with the ecosystem instead of fighting it.
I learned this approach the hard way after watching a colleague skip the understory analysis on a project near Algonquin. Six months after opening, dense sumac growth blocked all the safety sightlines, forcing a costly redesign. That mistake taught me why each layer matters and why you can’t rush the process.
Whether you’re scouting a new site, expanding an existing course, or planning a weekend adventure challenge for youth groups, this four-level framework keeps you organized and thorough. You’ll need basic surveying tools, a good eye for tree health, and about two full days on-site for a typical 2-3 hectare plot. The payoff? A detailed, defensible site plan that satisfies safety audits, respects the forest, and delivers the kind of heart-pounding experience your participants will remember for years.
What You’ll Need: Essential Tools and Materials
Before you head into the field, gather your analysis toolkit. A well-equipped planner saves time and catches details that shape a safe, sustainable course.
Start with mapping fundamentals: topographic maps (1:10,000 or 1:20,000 scale works well for most sites), a reliable GPS unit with waypoint marking, and a compass as backup. Printed topos let you annotate on-site, but pairing them with digital tools unlocks layers of insight. Google aerial maps offer a free starting point for overhead views, while Ontario’s Land Information Ontario (LIO) portal provides provincial GIS datasets, elevation models, forest cover, wetland boundaries, at no cost if you register an account.
For aerial imagery, a consumer drone (check Transport Canada rules and park permits first) captures current canopy conditions and reveals access routes invisible from the ground. If drones are off-limits, recent satellite imagery through platforms like Sentinel Hub or USGS Earth Explorer fills the gap. Pair these with measuring tools: a laser rangefinder for quick distance checks, a clinometer or smartphone inclinometer app for slope angles, and a diameter tape for sizing anchor trees.
Field essentials:
- Hard hat, gloves, and sturdy boots for site walks
- Binoculars to scout canopy structure from below
- Flagging tape (biodegradable options exist) to mark potential anchor points
- Waterproof notebook and pencils, screens fail in rain or cold
- First aid kit and communication device (cell service is patchy in many Ontario forests)
- QGIS or Avenza Maps app for layering digital data in the field
An insider tip: download your maps and imagery before leaving cell range, and carry paper backups. Electronics drain fast in winter, and nothing beats a laminated topo when you are balancing on a slope with muddy gloves. Eco-conscious teams also pack out all flagging and use minimal-impact markers like GPS photos instead of spray paint.
Safety Warnings and Site Assessment Precautions
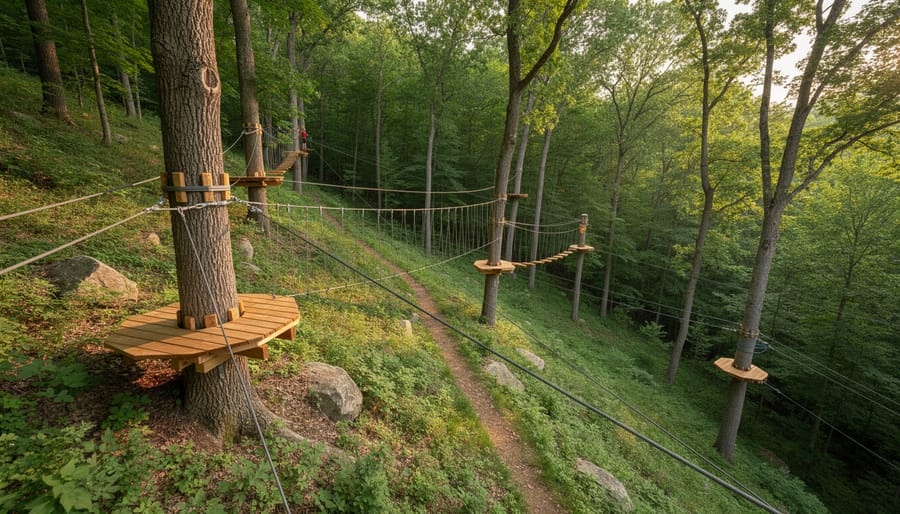
Before you set foot on site, proper preparation can mean the difference between a productive analysis day and a dangerous one. Start by checking Environment Canada’s forecast, sudden storms can turn forest floors slippery and make canopy work hazardous. Ontario’s spring and early summer bring nesting season, when disturbing certain areas can harm protected species; buffer zones protect nests and keep your project compliant. Learn to spot wildlife signs, scat, tracks, or nesting materials, so you can adjust your survey route and avoid surprising a bear or disturbing a hawk family.
Dead trees, known as snags, pose serious risks; they can drop limbs without warning or topple in moderate wind. Conduct tree risk assessments by looking for peeling bark, fungal shelves at the base, or hollow trunks before you mark anchor candidates. Erosion zones are equally critical, gullies and undercut banks shift over time and can destabilize platform footings later. Walk the perimeter slowly, noting any washouts or soft soil that squishes underfoot.
Protected ecosystems, like wetlands or rare trillium patches, are off-limits for construction and sometimes even foot traffic. Consult Ontario’s Natural Heritage Information Centre maps during your desktop prep, then flag sensitive areas in the field with biodegradable tape. Respecting these zones not only keeps you legal but also preserves the natural beauty that draws visitors to your course in the first place.
The 4 Level Map Analysis Process: Step-by-Step
Level 1: Regional Overview and Access Assessment
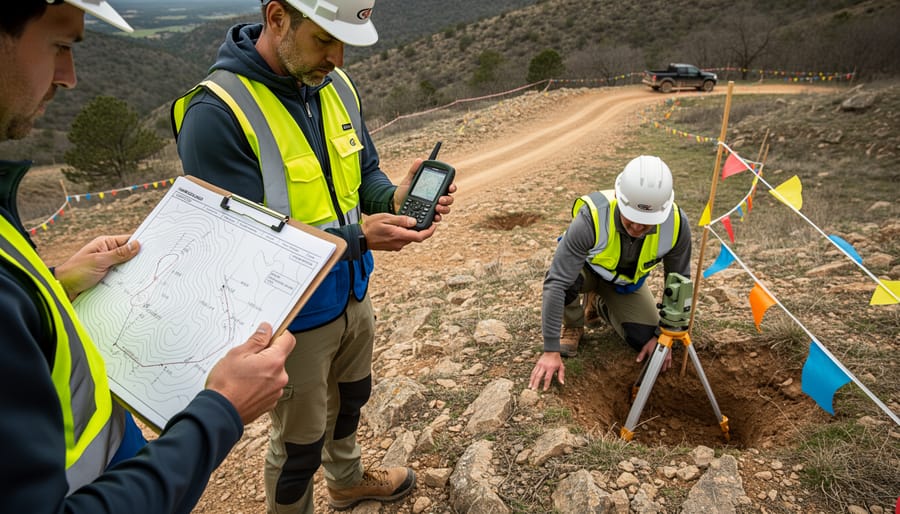
Level 1 sets the foundation by stepping back to see the big picture. Before you get lost in individual trees or cable angles, you need to understand how your proposed aerial adventure site fits into the surrounding landscape.
Start by pulling up satellite imagery of the entire property and its surroundings. Google Earth is free and surprisingly powerful for this initial scan, though Ontario’s provincial Land Information Ontario portal offers higher-resolution imagery for many regions. Zoom out far enough to see the full context, are you nestled in a dense forest block or perched on an isolated woodlot? Note major water features like rivers, lakes, or wetlands that could affect seasonal access or create stunning visual backdrops for your course.
Next, trace access routes from the nearest highway or town. Mark existing roads, trails, and potential parking areas on your map. A fantastic canopy site means nothing if participants can’t reach it or if emergency vehicles would struggle during a rescue. Measure distances to services like hospitals, which matters for your safety plan and insurance requirements.
Pay attention to elevation changes across the broader area. Even gentle regional slopes influence drainage, wind exposure, and where you’ll find the sturdiest anchor trees. Ontario’s varied topography, from Niagara Escarpment cliffs to flat boreal expanses, demands different design approaches.
This macro view also reveals neighboring land uses. Spot residential areas, protected conservation zones, or active logging operations early, before they become permitting headaches. You’re building a mental model of the entire context, not just your slice of forest.
Level 2: Site-Specific Terrain Mapping
Level 2 takes you from the big picture into the dirt and trees where your course will actually live. You’re now focusing on the specific acre or two where platforms, cables, and participants will interact with the terrain. Pull out your topographic map (1:5000 scale works well) and overlay it with your aerial photos. Look for slope gradients first. In Ontario’s mixed forests, a gentle 5-10 degree slope often provides natural drainage without creating awkward platform height differences, while anything steeper than 20 degrees means you’ll need creative engineering or should relocate that section entirely.
Trace drainage patterns by following contour lines and looking for darker vegetation bands in your aerial imagery, those soggy zones spell erosion trouble during spring melt or after thunderstorms. Mark them as no-build areas. Soil stability matters more than most beginners realize. Sandy soils near shorelines or atop glacial deposits can shift under anchor loads, while clay-heavy soils in valleys hold firm but turn slippery when wet. If your site has existing trails, map them precisely. They often reveal the natural flow people already follow and can double as emergency access routes.
Now identify your anchor tree zones. You’re hunting for clusters of healthy hardwoods (maple, oak, ash) spaced 30-80 feet apart with trunks at least 12 inches in diameter. Circle these zones in green on your map, then mark natural obstacles, rock outcrops, dense thickets, dead standing timber, in red. This color-coded terrain map becomes your foundation for the canopy analysis ahead.
Level 3: Canopy and Vegetation Layer Analysis
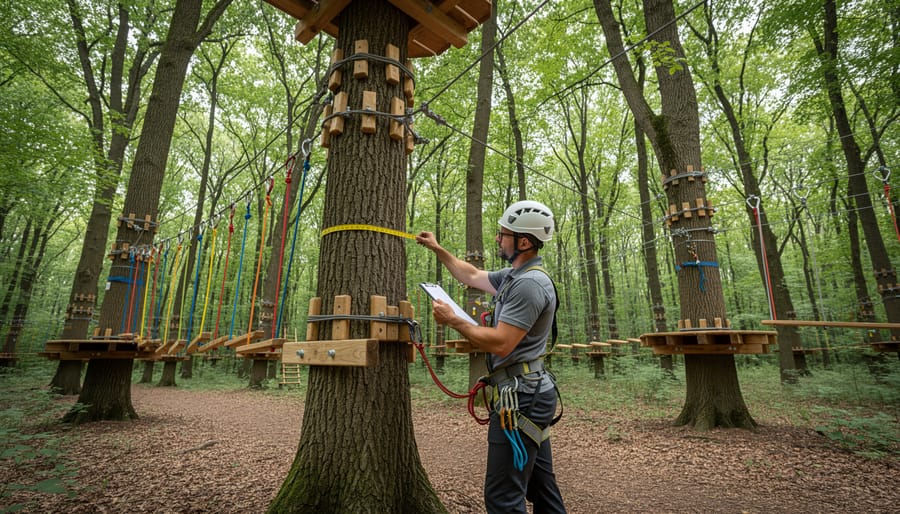
After mapping terrain, shift your focus upward. Level 3 analysis examines the canopy itself, the living architecture that will support your course. This vertical assessment determines which trees can safely anchor platforms and cables, and reveals spacing patterns that shape your route design.
Start by identifying tree species on-site. In Ontario, you’ll commonly encounter maples, oaks, and white pines. Each species has different structural characteristics: oaks offer dense, load-bearing branches but slower growth rates; white pines provide height but require careful branch assessment due to brittleness. Walk your mapped zones with a field guide or tree ID app, marking species directly on your map using colour codes or symbols.
Measure canopy heights using a clinometer, laser rangefinder, or smartphone inclinometer app. Record heights for potential anchor trees, noting that platforms typically need at least 4-6 meters of clear trunk below the canopy for safe installation. Measure spacing between suitable trees, 12 to 20 meters works well for most zipline and challenge elements, but tighter or wider gaps may require design adjustments.
Assess branch structure critically. Look for strong lateral branches, absence of decay, and minimal deadwood. Use binoculars to inspect upper canopy areas you can’t reach. Mark trees with visible trunk damage, cavities, or fungal growth as unsuitable, even if they seem sturdy from the ground.
Timing matters. Conduct canopy analysis in both leaf-on and leaf-off seasons if possible. Summer foliage reveals full canopy density and shading patterns, while late fall or early spring exposes branch structure and potential hazards hidden by leaves. Update your map annotations accordingly, distinguishing between confirmed anchor candidates and trees needing arborist evaluation before final approval.
Level 4: Route Design and Risk Annotation
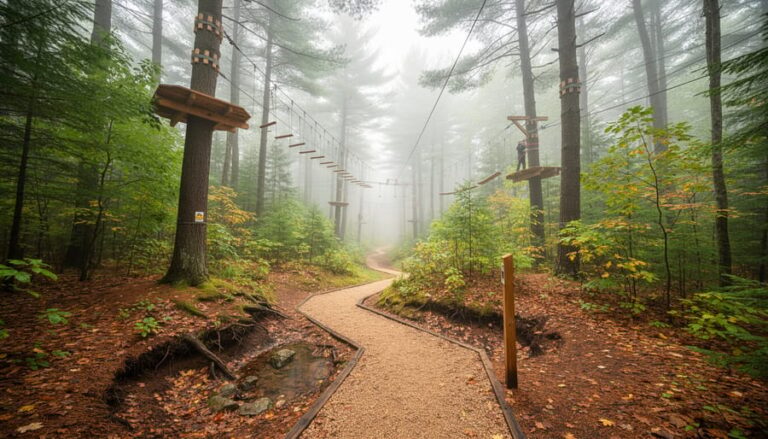
Level 4 transforms your research into a working blueprint. At this stage, you’re no longer just observing, you’re designing the participant’s journey from start to finish. Begin by marking platform locations on your map using the anchor trees identified in Level 3. Number each platform sequentially to establish flow, and note the elevation at every station. This creates a visual profile of your course’s difficulty progression.
Next, sketch cable routes between platforms. Use solid lines for primary ziplines and dashed lines for backup routes or alternate paths. Indicate the direction of travel with arrows, and mark approximate distances. Where cables cross existing trails or roads, flag these as coordination points, you’ll need clearance protocols during construction and operation.
Now layer in your safety infrastructure. Circle emergency access points where rescue teams can enter with equipment, and trace evacuation routes to ground level. Mark cell reception zones (critical for Ontario’s remote sites) and identify the closest vehicle access for each course section. If your site requires forest survival skills for staff during off-season maintenance, note seasonal access limitations.
Your Level 4 map should include these annotation elements in order:
- Hazard symbols, dead branches, wasp nests, unstable slopes, poison ivy patches
- Sight line indicators showing where guides can visually monitor participants
- Environmental buffers around bird nesting sites, wetlands, or protected vegetation
- Participant flow arrows illustrating traffic patterns and potential bottlenecks
- Staging areas for equipment storage, briefings, and gear checks
Use a consistent legend and color-code risk levels, green for clear zones, yellow for caution areas, red for no-go sections. This final map becomes your construction guide and your operational reference, so clarity beats artistry every time.
Verification and Next Steps: Validating Your Analysis
Your 4 level map analysis isn’t finished until you’ve verified it against reality. Think of this phase as quality control before you commit resources to construction or permitting applications.
Start with a stakeholder site walk. Bring your annotated maps to the actual location and walk the proposed route with your team, ideally including a certified arborist, a structural engineer familiar with aerial installations, and any landowners or park managers who need to approve the project. Compare what you’ve mapped against what’s physically there. Trees you marked as anchor points might show hidden rot when examined up close. Slopes that looked moderate on paper might feel dangerously steep when you’re standing on them. This is your chance to catch errors before they become expensive problems.
Test your GPS coordinates by physically visiting marked platform locations and emergency access points. Use a handheld GPS unit to confirm waypoints match your digital maps within acceptable accuracy (typically 3-5 meters for recreational GPS). If coordinates are off, recalibrate and update your master map immediately.
Cross-reference measurements with professional assessments. An arborist should verify tree health, species identification, and load-bearing capacity for any tree you’ve designated as an anchor. A structural engineer reviews slope calculations, cable span distances, and platform placement relative to terrain stability. Their reports become part of your documentation package.
Seasonal verification matters more than many first-time planners realize. Return to the site during different seasons, a route that works perfectly in summer might flood in spring or become inaccessible when snow obscures trails. Leaf-off conditions in fall and winter reveal canopy structure you couldn’t assess in summer. Update your maps to note seasonal risks.
For Ontario regulatory approval, compile a verification package that includes your original 4 level maps, professional assessment reports, site photos with GPS tags, a summary of changes made during verification, and a maintenance schedule showing when you’ll re-evaluate conditions. Conservation authorities and municipal planners want to see that you’ve done your homework. Include dated documentation of site walks, written confirmation from arborists and engineers, and before-and-after comparisons if you adjusted routes based on field findings.
Iterate the analysis whenever conditions change significantly. After major storms, insect infestations affecting tree health, or erosion events, repeat at least Levels 3 and 4 to confirm your course remains safe. For active courses, annual reviews of all four levels catch gradual changes like tree growth affecting cable tension or shifting soil compromising platform anchors. Your analysis is a living document, not a one-time task.
Frequently Asked Questions About 4 Level Map Analysis
How long does the full 4 level analysis take?
For a typical aerial adventure site in Ontario, expect 2-4 weeks from start to finish, about two days for Level 1 regional overview, three to five days for detailed site mapping (Level 2), a week for canopy assessment including multiple site visits (Level 3), and another week for route design and annotation (Level 4). Weather, property size, and forest density all affect the timeline.
Do I need professional surveying experience?
No formal surveying certification is required to conduct 4 level analysis for initial planning, but you should be comfortable reading topographic maps, using GPS devices, and identifying tree species. Many course operators start the process themselves then hire arborists or engineers to verify technical details before construction.
What mapping software works best for beginners?
Google Earth Pro (free) is excellent for Levels 1 and 2, offering satellite imagery and basic measurement tools. For more detailed work, try QGIS (free, open-source) to layer Ontario GIS data, or Avenza Maps for field-based GPS tracking. Paid options like ArcGIS Online offer advanced features but aren’t necessary when starting out.
Can this method be used for existing courses?
Absolutely, retrofitting the 4 level analysis helps identify maintenance needs, expansion opportunities, and previously overlooked risks. Many operators rediscover better routes or spot erosion issues they missed during initial construction.
Updating your maps isn’t just good practice, it’s essential for safety. Conduct a fresh Level 3 canopy assessment annually before each operating season, since storms, disease, or growth patterns change tree stability. After major weather events like ice storms or high winds, re-verify anchor trees and access routes immediately. Level 4 route annotations should be updated whenever you modify platforms, add elements, or notice new hazards. This rhythm keeps your analysis current and aligns with leave no trace principles by catching environmental changes early.
Ontario doesn’t mandate 4 level analysis specifically, but municipal building permits, provincial park use agreements, and liability insurance often require detailed site plans that this method naturally produces. Contact your local planning department early, some jurisdictions want engineered drawings, while others accept annotated aerial photos with GPS coordinates.
Mastering 4 level map analysis transforms how you approach aerial adventure course planning, you’re not just picking trees and stringing cables, you’re designing with intention and care. Whether you’re envisioning a commercial zipline park or a modest backyard challenge course, starting with Level 1 saves you costly mistakes and protects the environment you’re building in. Thorough pre-construction mapping means fewer trees cut, less soil disturbance, and routes that work with the landscape instead of against it.
Before you break ground, visit some of Ontario’s established aerial parks to see thoughtful design in practice. Notice how the best courses flow naturally through the canopy, how platforms nestle into stable anchor trees, and how sight lines keep everyone safe. Combine what you observe with careful GPS scouting and field notes, and you’ll develop an eye for what works.
Remember: every course you plan lives in a larger ecosystem. Respect the land, prioritize visitor safety, and let your maps guide you toward sustainable adventure that future generations can enjoy.






+ There are no comments
Add yours